


Written by: Eugene Steuerle
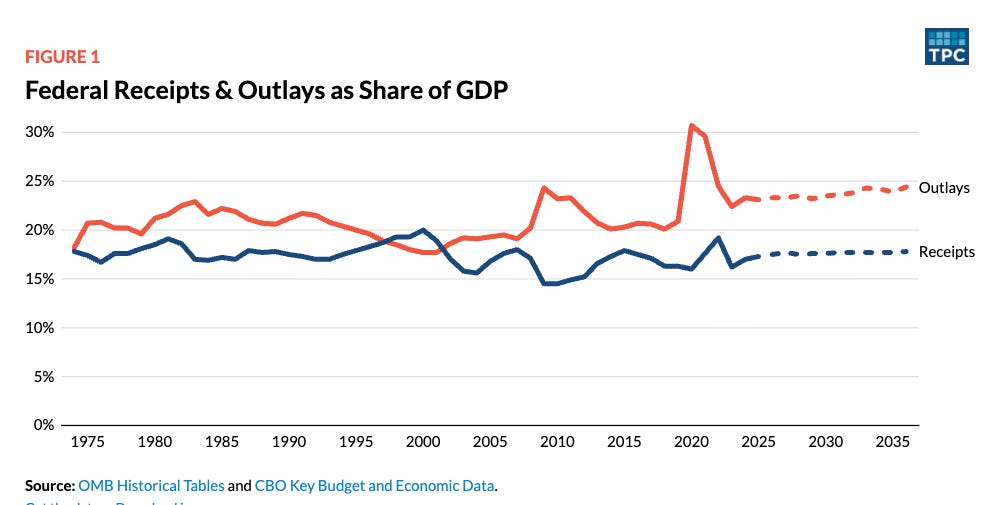
The US debt problem stems from a long-running failure to keep federal spending and revenues in closer balance with the economy’s growth. The unsustainability of that pattern becomes especially apparent when receipts, outlays, and debt are shown relative to our income (i.e., as a share of gross domestic product, or GDP) (Figure 1).
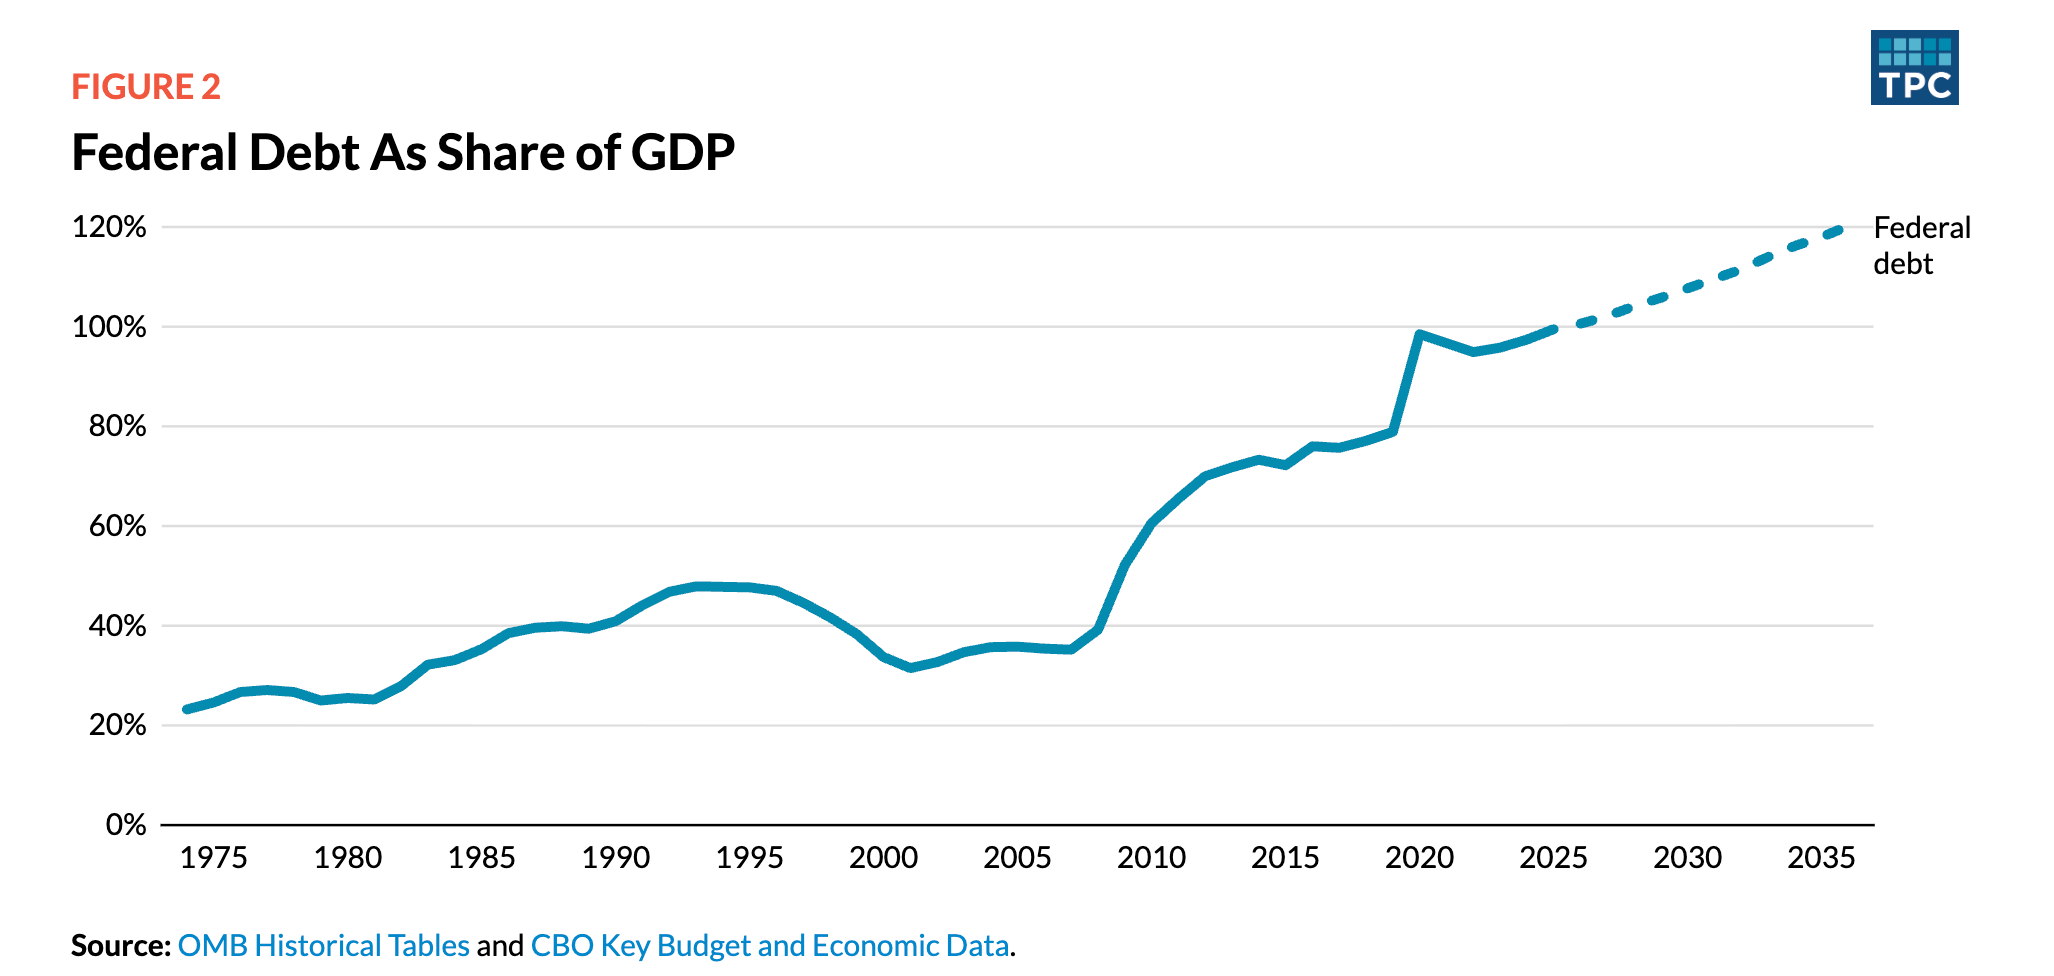
The year 1974 provides a useful base for examining the modern growth in federal debt. The debt-to-GDP ratio hit its post-World War II low then, having fallen from over 100 percent to less than 25 percent of GDP over almost three decades. But then it took off. (Figure 2).
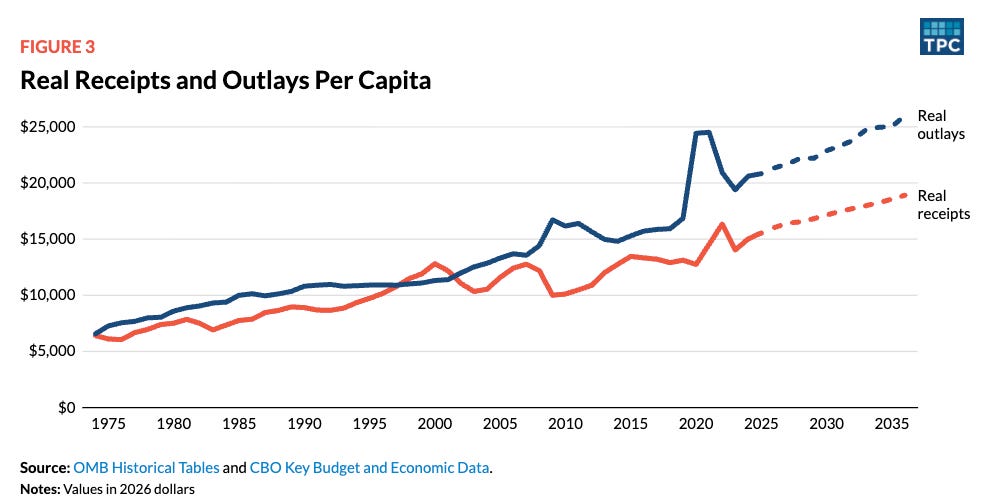
These trends become even clearer when calculated on a per capita basis (in 2026 inflation-adjusted dollars). In 1974, Congress collected an average of $6,414 from each person and paid out $6,564 in cash, goods, services, and interest. Thus, the federal budget was nearly balanced—despite the end of the postwar economic boom, a low point in the Dow Jones Industrial Average, the first oil shock, and a major peak in 1970s inflation. Just over half a century later, in 2025, the federal government collected $15,555 and paid out $20,831 per capita. (Figure 3).
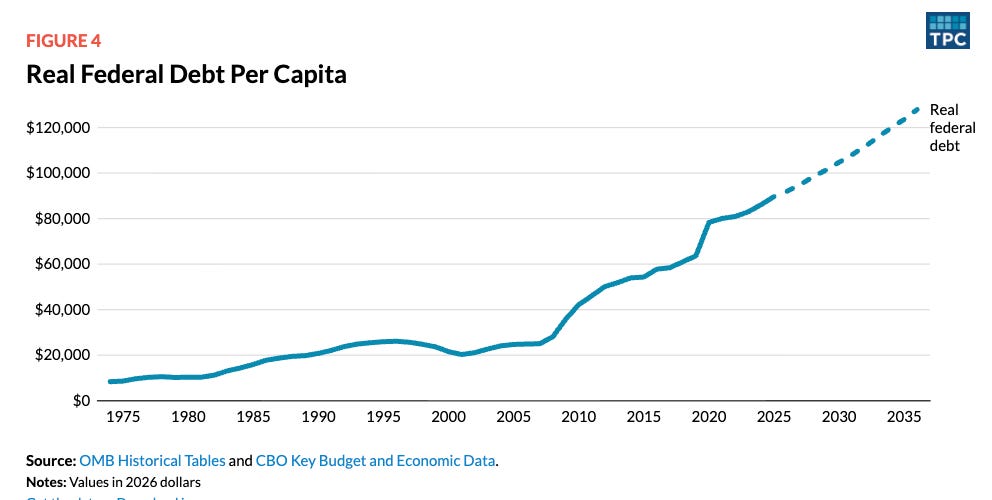
Meanwhile, real federal debt per capita climbed from around $8,400 to $89,700. The debt grows much faster than outlays or receipts because borrowing to cover past deficits keeps adding to the debt. Under current law, debt per capita will rise to about $128,000 by 2036 (Figure 4). At an average household size of 2.5, that would equal about $320,000.
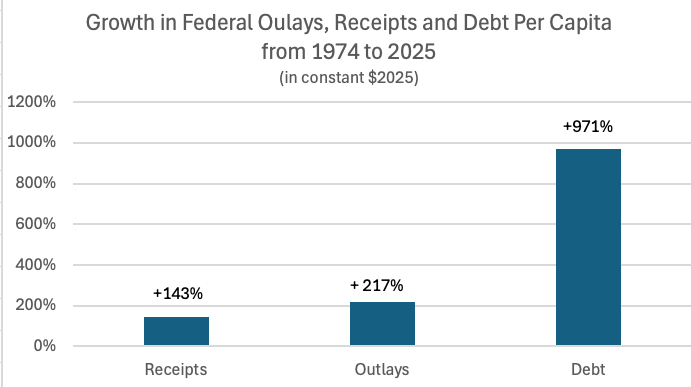
By 2025, on a per-capita basis, Congress had increased real revenues by 143 percent, outlays by 217 percent, and federal debt by 971 percent (lead figure at the top).
Federal receipts and outlays went in opposite directions as a share of GDP
Comparing the 1974 to 2000 period with this century, 2001 to 2025, average receipts fell by about 1.2 percent of GDP, while outlays per capita increased by about 1.2 percent. As a result, average annual deficits in the 21st century nearly doubled, from roughly 2.7 to 5 percent of GDP.
Many factors affected the level of receipts. Over both the 1974-2000 and 2001-2025 periods, Congress enacted many tax cuts, while the development of new tax shelters helped lower effective tax rates. On the flip side, Congress enacted some tax increases, usually on a smaller scale. As nominal incomes rose, however, many taxpayers were pushed into higher tax brackets, increasing individual income tax collections. Indexing for inflation limited this “bracket creep” to real income growth after 1984. Meanwhile, the growth in the share of total income earned by those already in higher-income tax brackets helped offset the decline in average tax rates.
On the other side of the budget, outlays as a share of GDP increased from 1974 until the early 1980s, then tended to decline for most of the rest of the 20th century. In the 21st century, they have risen again, mainly due to longstanding congressional mandates that Social Security and healthcare grow automatically faster than the economy. Congress often did limit appropriations for discretionary spending, so it fell as a share of GDP. But high automatic growth in mandatory spending kept building on an ever-larger base.
In this century, extraordinary and unprecedented fiscal deficits after two major crises, the Great Recession and COVID-19, prompted a sharp temporary rise in federal debt as a share of GDP (Figure 2). Congress, however, did little to cover the costs of these efforts—including interest costs on that extra debt.
By the time of the post-COVID-19 era from 2023 to 2025, deficits average about 6 percent of GDP, an all-time high for peacetime years with low unemployment. Those deficits will stay at that level on average through 2026 to 2036, under current law, as estimated by CBO in early 2026. Even these numbers exclude the unknown cost of the increase in defense spending due to the war with Iran.
Because the gap between spending and receipts has widened to unprecedented levels, CBO projects interest costs on the debt to keep escalating, and the debt-to-GDP ratio to rise well above 100 percent.
The basic failure of modern fiscal policy
These numbers show that the central fiscal story of the past 50 years is not simply about a choice between bigger government, defined by spending increases, and smaller government, defined by tax cuts. In a sense, we got a lot of both, but mainly a huge increase in debt. Of course, as we move forward, automatic spending increases are enormous, not the least because of rising interest costs.
These numbers point almost unequivocally to the fundamental failure of modern fiscal policy: For decades, policymakers have approved spending growth, tax cuts, and crisis responses without fully funding them. The result: Some generations have enjoyed the benefits, while future generations find themselves paying a bill that increasingly preempts other uses of their tax dollars.
**This column is largely reproduced from Tax Vox, April 30, 2026.
Related: Rethinking Retirement Benefits as Worker-To-Beneficiary Ratios Keep Falling